How emulation was used to debug out-of-spec power on a multicore ARM design using the AXI bus.
Source: TDF
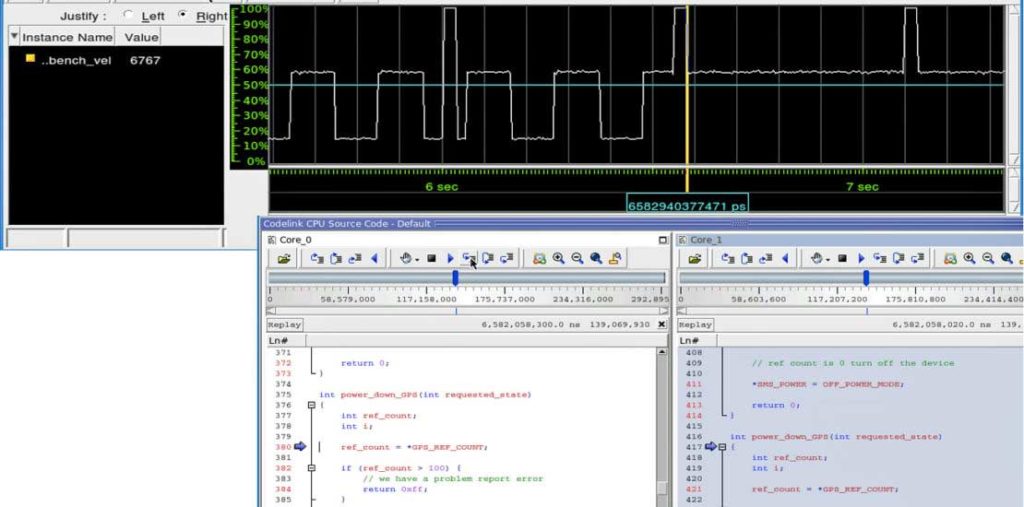
Modern system-on-chip (SoC) designs include a vast amount of embedded software that makes them each unique, presenting challenges for failure analysis and debug. Through a stacked structure – made up of drivers, operating systems and applications – the software implements most of the functionality for a variety of applications, whether in networking, storage, mobile or another segment. Secondly, and equally important, the software manages design services, such as low-power management.
In terms of power consumption, software plays a fundamental role in two areas. The first is the computations performed by embedded processors. The greater the processing, the more power is burned. The second is the active power management of the system.
Today, a substantial amount of SoC hardware implements design structures for saving power, such as power domains, dynamic clock frequencies and dynamic supply voltages. This entire hardware infrastructure is operated by software.
Validating software to ensure that the power management performs to specification is critical to avoid costly respins or non-yielding silicon. Therefore, measuring realistic power before silicon tape-out is of paramount importance.
Achieving accurate measurements here has two requirements. The first is a testing environment adequate that supports processing of realistic workloads in the SoC in a reasonable amount of time. Register transfer level (RTL) simulation cannot do this. Hardware emulation is the ideal candidate.
The second requirement is full design visibility so that you can monitor the switching activities of all registers and wires throughout the design. This is necessary to estimate power consumption. For accurate power estimation, you must also take into account the post-layout capacitance of all registers and wires. Without considering the layout data, it is impossible to get an approximate idea of the power consumption. This requirement rules out field programmable gate array (FPGA) prototyping, but emulation is again a perfect fit.
The Veloce Power App supports these requirements and more. It can verify that multiple power domains defined via the unified power format (UPF) standard operate as expected. It can track average power consumption over an extended period of time to determine the lifespan of the battery. It can trace time-based power consumption and pinpoint power peaks that may overload and shut off the battery. It can generate an activity plot that graphically shows the areas of high, medium and low activity and keeps track of which power domains are on and off (Figure 1
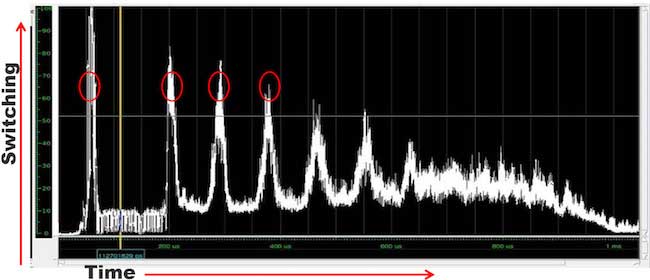
The power plot provides a level of visibility that no other view of the SoC design can. As useful as waveforms are in finding the timing relationships necessary for unearthing design bugs, they are hard to use when it comes to quickly identifying anomalies in multi-power domain management schemes.
Integrating such a power plot with a waveform viewer and the Mentor Codelink product makes a global hardware/software debugging environment possible. Codelink, a trace-based tool for non-intrusive software debug of designs with multiple cores, can monitor the activity in the embedded software by, for example, identifying what programs are running on which cores at a particular point in time. By correlating this information with the information embedded in the activity plot and waveform charts, you can efficiently and rapidly verify whether the power management software does what it is intended to do, and if not, track down the causes of faulty behavior.
Case study for failure analysis and debug
This case study describes the actual failure analysis and debug of an SoC design at a major semiconductor company. The SoC includes multicore ARM IP plus a set of peripherals, including GPS and SMS interconnected via an Advanced eXtensible Interface (AXI) bus. The peripherals serve several applications. Each peripheral has a dedicated power domain controlled by software.
A reference count register in each peripheral keeps track of how many processes are using the power domain at any given time. When a process starts to access a peripheral, it reads the reference count register, increments it and writes it back. If, before incrementing it, the reference count is ‘0’, the peripheral needs to be powered up first. If the reference count is more than ‘0’, some other process is using the peripheral that should be powered up already.
When a process stops using a peripheral, it reads the reference count register, decrements it and writes it back. If after being decremented, the reference count is ‘0’, the software process concludes that no processes are using the peripheral and it can safely power it down. If the reference count is not ‘0’, then some other process is using the peripheral and the power domain controlling the peripheral should be left on.
The case study design was taped out, and once early silicon was returned from the foundry, it was verified in the lab. Disappointingly, the engineering samples consumed more power than expected, though apparently at random. This implied a shorter battery life than anticipated.
On closer inspection, when no processes were running and the device was left powered up, battery life was as estimated. When the processes were running, the battery life burned a little more power, and when all the processes were turned off, the power consumption was projected to drop. But in that last case, sometimes it did, sometimes it did not, and occasionally the battery ran down quickly.
In the lab, an ammeter was attached to the chip to measure the power consumption by each process. When a process was active alone, consumption was within specification, and when that process terminated, it properly turned off the peripherals it had previously turned on. Then, multiple processes were tested concurrently. Here, it turned out that one of the power domains was still on even though all the processes using it had terminated.
The engineering team used a JTAG probe to check the reference counters and found that in one peripheral shared by two processes the power was left on even though both processes were not running.
The hardware and software teams were asked to check their work. After checking every possible code path, the software team confirmed that when the processes were terminated, all power domains were turned off. The hardware team could prove conclusively that if the power domain was disabled by software, it was indeed turned off.
But the problem remained. More design visibility was necessary for debug and the engineering team turned to hardware emulation. They booted the OS and ran the applications in emulation. They traced the hardware and captured waveforms around time marks where they were shutting the peripheral down only to confirm that there was no issue. They used livestream to look at some long runs over time around the counter, examining whether accesses to the counter and all functionality worked correctly.
On the software side, they set breakpoints at the applications’ termination. Every time they stopped and stepped through the code, they were assured that the peripheral was properly turned off. They never saw an application exiting without turning power off.
Debugging via JTAG was interfering with the design activity and it could not be used. Instead, they used the Veloce Deterministic ICE App to remove the randomness of the ICE environment and make it repeatable and deterministic. The App captures the activity of physical peripherals in an initial ICE run, and saves it in a reply database that can be executed multiple times deterministically.
By running the emulator in this mode, the team could reproduce the problem. The engineers could acquire waveforms at any point in time from the run in replay mode without perturbing the design. They could capture Codelink software debug traces, track the switching activity of the design and generate the Activity Plot.
Analysis with Activity Plot and Codelink
The engineering team knew when the failure occurred, which power domains were affected and the processes that were using those power domains. Two processes, a GPS and a radio, were identified in the test case. When both were inactive, the base level sat at about 18%, showing a low level of switching activity (Figure 2).
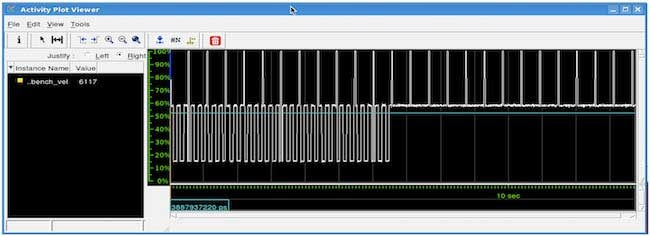
The short spikes correspond to the switching activity of the GPS process, while the tall spikes take into account the activity of the process that uses both the GPS and the radio. The GPS process runs more frequently than the process that uses both the radio and the GPS.
The plot shows an anomaly in the activity of the GPS process that remains active when it should be turned off after some run-time.
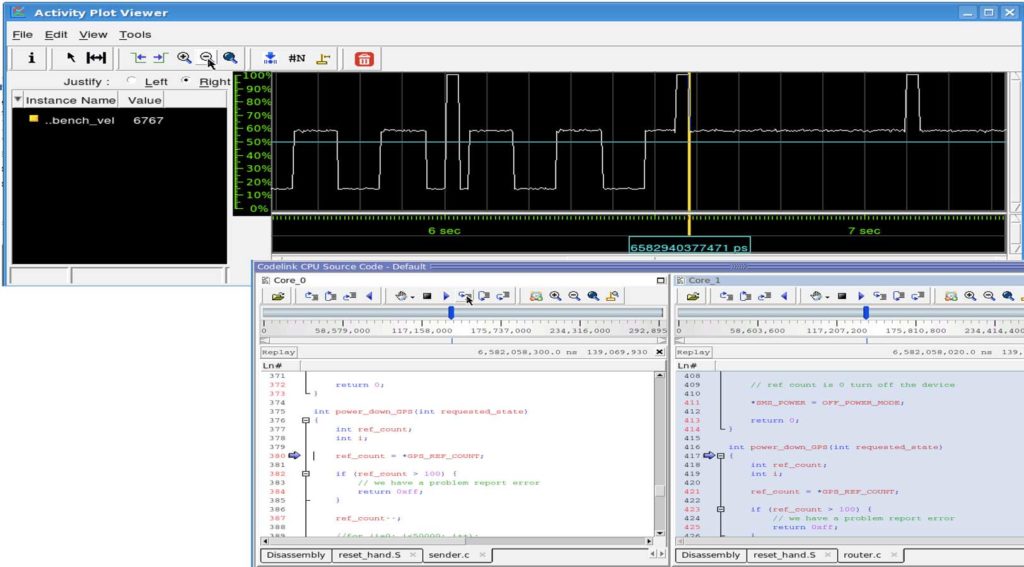
The integration of the activity plot with the Codelink viewer allows for tracking a problem across hardware and software domains. Adding a cursor in the activity plot window displays a small arrow in the Codelink viewer that tracks the corresponding position in the program code (Figure 3).
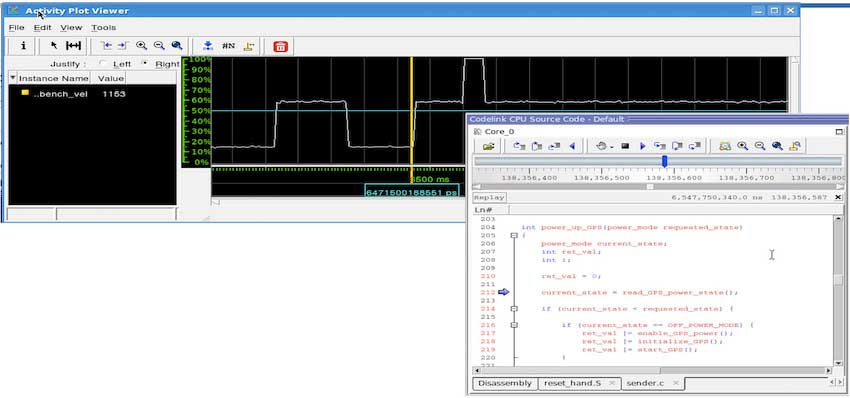
The code shows that the program is powering up the peripheral and the activity plot indicates that the power is going to turn on. This is a multi-core system and Codelink displays the running jobs in each core in a dedicated window per core. When the cursor is moved to the anomaly in the activity plot, Codelink shows two cores powering down the GPS. Both of these processes are running unsynchronized and both turn out to reach this shut down point at almost exactly the same time (Figure 4).
n the power-down routine, both cores read the reference counter logging a value of ‘2’, indicating that two processes are using the peripheral. Both cores decrement the reference count from ‘2’ to ‘1’ and when done, they write 1 back into the reference count register and exit the process.
Now, there are no more running processes, but the reference counter stores a ‘1’ and the power domain is left on. When an upcoming process accesses the counter, it will find it in use, increment the counter to ‘2’, decrement it to ‘1’ when done. So, the power domain will be left active until the system reboots or the battery runs out of power
Race condition?
This looks like a classic race condition. Two threads on two different processors almost concurrently reading the reference counter, decrementing it and writing the result back into it.
Obviously, this is an unusual occurrence.
The preliminary conclusion was that neither the software team nor the hardware team had implemented an exclusive access condition to prevent both cores from updating the same location at the same time. With an exclusive access, only the first process reads the counter exclusively preventing other reads from that register until the first process performs a write.
A deeper investigation proved that both teams did what they were expected to do. The hardware team implemented support for the AXI Exclusive Access bus cycle. The software team implemented an exclusive access instruction to access the reference count register.
The AXI Protocol
AXI is the protocol used by many SoCs today. It is part of the ARMAdvanced Microcontroller Bus Architecture (AMBA) specification, and advantageous for high-bandwidth and low-latency interconnects. For point-to-point interconnect, the protocol works by establishing communication between master and slave devices via a handshake-like procedure before all transmissions.
On a typical AXI bus, there are multiple masters and multiple slaves. In an exclusive access, a master issues an exclusive access request and a slave implements it: That is, it executes only a subsequent access request from the same master and rejects any request from a different master.
This SoC design had a quad-core processor and in the master ID, each CPU was identified by a couple of bits. When a CPU issues an access command, the receiving slave should look at not only which master sent the request, but also which core within the master did so.
The engineers overlooked this detail and designed the slave assuming that two requests from the same master were acceptable, albeit from different CPUs. They then proceeded to serve them both, causing the problem.
A misinterpretation of the AXI specification had caused the problem. Debug was now possible.
Conclusion
The test case proves that tracking down an esoteric design bug is only possible via a combination of integrated tools that afford visibility into the SoC hardware and software running on a high-speed emulation platform. An emulator supports visibility into the SoC design with fast execution speed to process embedded software to the point where the problem can be reproduced.
Codelink provides visibility into the SoC software code with correlation across cores and hardware and software views. Its non-intrusive nature does not move any of the events allowing for those events to line up in order for the failure to occur.
The activity plot lets designers quickly identify the area/time of peak power consumption for honing in on a potential problem.
This combination enables efficient and effective diagnosis of the most difficult bugs and, thereby, the implementation of higher performance, more capable designs.
About the author
Lauro Rizzatti is a verification consultant and expert on hardware emulation. Previously, he held positions in management, product marketing, technical marketing, and engineering.