A virtual probe enhances hardware emulation’s appeal as data-center resource for hardware designers and software developers when it comes to verification.
Source: Electronic Design

Hardware emulation continues to prove itself as a handy tool for hardware/software co-verification and testing the integration of hardware and software.
Booting an operating system and executing software applications takes billions of verification cycles—a task that defeats traditional software-based analysis tools. Only hardware-based verification engines provide the throughput necessary to meet the challenge. That’s why hardware emulation and FPGA prototyping have become mandatory engines in the verification toolbox of today’s design-verification teams.
With hardware emulation and FPGA prototyping, embedded software developers can validate embedded software and perform system validation—a rather attractive feature. Only emulation allows them to confirm that the embedded-system software works with the underlying hardware, since FPGA prototyping doesn’t provide the visibility in the hardware design to debug the inner workings.
Also, emulation is usually available to project group members much earlier in the design cycle than an FPGA prototype. Thus, with emulation, software development can begin earlier than with FPGA prototypes.
Hardware engineers can realize the benefits of running software on hardware emulation, too. When actual product software is run on hardware for the first time, it almost always exposes hardware bugs missed by the most thorough verification methodologies. Running software early exposes these bugs when they can be addressed easily and inexpensively.
Physical Probes
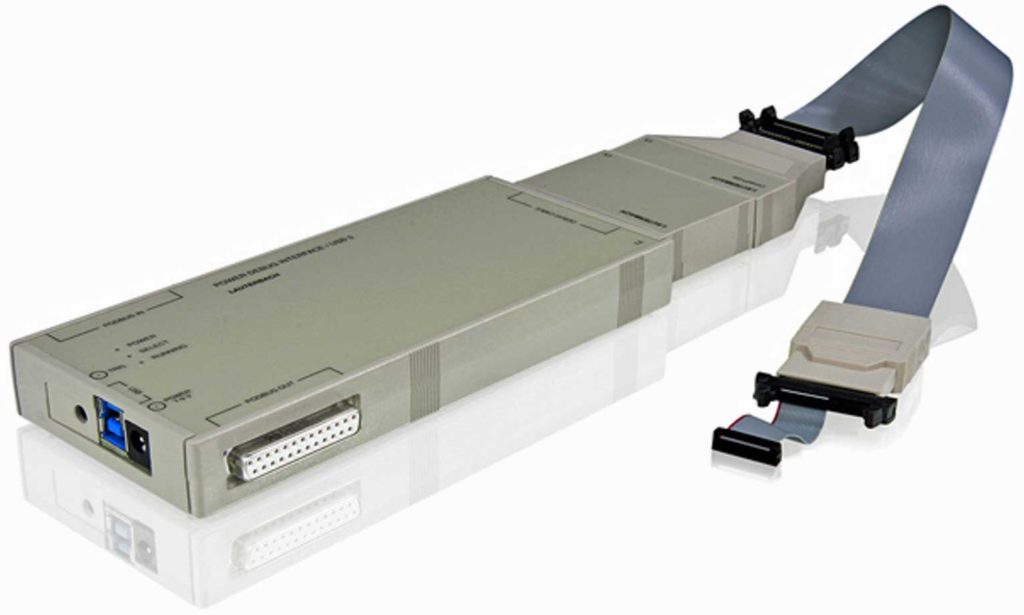
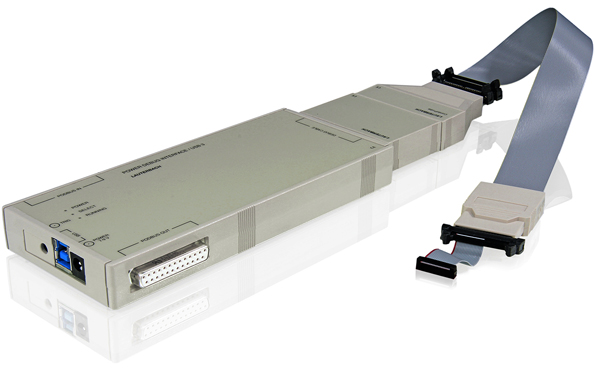
Traditionally, software developers use a physical JTAG probe to debug their code running on an emulator (Fig. 1). The JTAG standard defines a set of signals and a method of reading and writing registers in a physical chip through a four-pin interface. This was originally intended as a way of testing chips, giving test engineers a way to peek inside a packaged piece of silicon to see if it was working correctly or not.
Software developers realized that they could use this same interface to read and write the general-purpose registers of a processor in a chip. Being able to read and write the main registers of a processor meant that it was possible to debug programs running on the processor.
Through some clever interfacing, embedded debuggers—like Lauterbach’s Trace-32 or ARM’s DS-5—can be used to send commands to a JTAG probe to retrieve or set the state of the processor on a board connected to the probe. This is the most common way for developers to run and debug “bare metal” programs and drivers on embedded systems.

1. Software developers use a physical JTAG probe to debug their code running on an emulator.
With today’s emulation systems, any of the design’s signals can be brought out through an I/O card connected to external devices. This approach can be used to bring out the four signals that make up the JTAG interface. By connecting these signals from the design in the emulator to a JTAG probe, software developers are able to perform the same debug activity on the emulated design as they would on a prototype board.
Since the JTAG probe is the one that will be used later in the design cycle on a prototype board, and probably used on the last project, software developers are generally acquainted with how to use it and what it can do. When faced with debugging software on a design in emulation, software developers naturally reach for this familiar tool.
While the JTAG interface enables the debugger to read and write registers directly, properly debugging a program also requires the ability to read and write memory, as well as control the execution of the program. To address this need, processor designers have added registers that can be accessed by the debugger to insert memory read and write instructions into the execution pipeline. This gives the debugger full access to all memory and memory-mapped devices in the design.
Also, these designers incorporated breakpoint registers and other debug support circuitry to allow JTAG debuggers to control the execution of the program. This means that with a JTAG connection to a processor, the debugger can show the source code of the program, the processor’s registers, the memory, variables, and the program’s stack. As a result, the debugger is able to set breakpoints, and run and single-step the program, features that a software developer expects from a modern software debug environment.
Dealing with JTAG Probe Issues
While a JTAG probe enables capable software debug on a design in emulation, it has drawbacks. One is that the JTAG probe and the design running in the emulator have their own free-running clocks. To keep things synchronized, these clocks must maintain a consistent speed. If they do not, the connection between the debugger and the design will be lost.
In many cases, the probe will need to be reset and, sometimes, the design itself will need to be reset. Slowing or even stopping clocks in the design in the emulator is useful because it allows waveforms on the design to be captured and uploaded. It also enables the developer to look at the state of the design or force signals to new values. Essentially, hardware developers lose a rich set of hardware debug features when the clocks on the emulator can’t be slowed or stopped.
A second problem with using a JTAG probe is performance. Because there are two independent clock domains, one on the emulator and the other on the probe, and data will pass between these domains, it creates a clock-domain crossing problem. To address this, clocks on the probe usually are run at a fraction of the speed of the processor’s clocks. On prototype boards, where the processor’s clocks run at hundreds of megahertz or even gigahertz, this isn’t a problem. In emulation, though, the clocks run at one or two megahertz, and it can slow things down a lot.
Another problem with performance is program download time. Software developers use the scan chain to download programs to the target through the JTAG probe. If the program is large, it can take an hour or longer to load a program into memory. Most software developers will not accept this level of performance.
JTAG Transactor
An approach to using a JTAG debugger mitigates these problems. Emulation systems are able to drive and sample any signal in the design through the circuitry and programming built into the emulator. Rather than pull signals out of the design through an I/O card and driving them with a physical probe, a “transactor” can be used to programmatically drive the JTAG signals in the design. The same values will be driven on the same signals just like that of the physical probe, delivering the same debug capabilities.
Since both the design and the JTAG transactor are under the control of the emulation system, the clocks are controlled by the emulator. Clock domains can be synchronized, eliminating the problems with multiple clocks.
This means that clocks on the emulator can be slowed or stopped to perform hardware debug activities, like collecting waveforms or examining the design. The connection between the design and the JTAG transactor is no longer based on the passage of time; rather, it’s under the control of the emulation system.
The emulator is free to slow or stop the clocks and then start or speed them up later in order to not lose the connection between the design and the debugger. This enables hardware designers who have JTAG debugger connections in their designs to utilize the full set of hardware debug features available with the emulator. This also makes it possible to use more complex testbenches on designs in emulation.
Testbenches likely to slow the emulation throughput––such as Open Verification Methodology (OVM), universal verification methodology (UVM), and those that implement coverage and assertions––can’t be used when there’s a physical JTAG probe. They are able to be used when there’s a virtual JTAG connection, though.

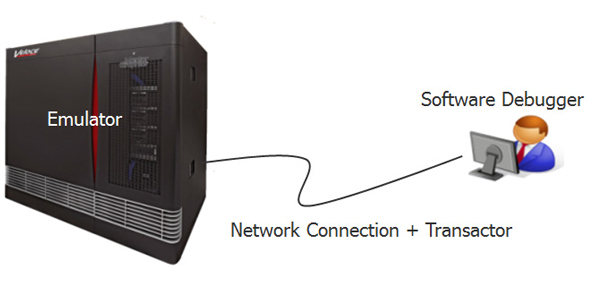
2. A virtual probe uses hardware emulation to drive and sample design signals without the need for an I/O card plugged into the emulator.
Another benefit is that the clock for the JTAG transactor can be run at the same speed as the processor’s clock without worrying about synchronization. With this approach, the JTAG clock can be run at the same speed as the processor’s clock, representing a three- or four-fold increase in debugger performance and responsiveness.
Other benefits are derived by virtualizing the connection. Since waveforms can be collected and uploaded, it’s possible to collect switching data over the run of the design. This can be used to find power spikes, and with the software debugger active, it can begin to bring together a correlation between software activity and power consumption (more on that in Part 2 of this article).
The virtualized connection to the design allows for a broader connection from the debugger. Therefore, more than just the JTAG signals can be included in the interface, and the debugger will affect more of the design. Specifically, it’s able to directly reset the design.
If the design gets into a wedged or non-responsive state, the debugger could issue a hardware reset and bring the design back to a known state. The debugger also can cause a trigger event for capturing waveforms, allowing a developer to see waveforms that correlate to a known location in the software. A developer can set a breakpoint in the software and direct waveforms to be captured around where that breakpoint is reached.
It’s possible to arbitrarily save and restore a virtualized connection. Since the emulator has full control over the state of both sides of the debugger connection, the save and restore capabilities of the emulator can be used with designs that have a virtual JTAG connection.
Without the need to connect to a specifically configured I/O card, the design can be loaded into hardware emulation on any set of logic boards (Fig. 2). The virtual probe enables more flexibility in running the design, offering engineering groups a way to use hardware emulation as a data-center resource shared across multiple projects and divisions.
Finally, with a virtual probe, a software developer doesn’t have to maintain physical hardware and connect it to hardware emulation. With many engineering groups using hardware emulation as a data-center resource, software developers can be thousands of miles from the hardware emulation system they’re using, making it impractical to physically hook up a probe.
Hardware emulation continues to evolve with new features, capabilities, and use models, turning it into a versatile verification tool for both hardware designers and software developers. The availability of a virtual probe enhances its appeal as a data-center resource and so much more.