Techniques previously unavailable during ICE or testbench acceleration can now greatly speed emulation debug in those modes
Source: Tech Design Forum
Hardware emulation has come a long way recently but there remains room for improvement. Its use for debug is a good example. Debug rests on the ability to track the activity or waveforms of all the design elements required to trace a bug to its root cause.
Simple arithmetic says if you apply the tool with brute force, one second of real time processed by an emulator running at 1MHz will generate 1 Mbit of data for each gate output. That is roughly one-bit-per-clock-cycle, assuming no data compression or optimization. It follows that a 100M-gate design will produce 100TB of data per second of real time.
Unoptimized data volumes create two headaches. First, you need unbelievable storage capacity. Second, it takes an unacceptably long time to transfer data from the emulator to storage media for post processing and waveform display.
To make matters worse, debug data generation for a long emulation run-time slows down the emulator by up to two orders of magnitude, or 100X. This is a poor use of expensive hardware.
The good news is that we have been working on the problem and various approaches are already available. For example, virtually all emulator vendors offer data compression and optimization techniques that reduce storage capacity.
If a gate’s output does not change state for 1,000 consecutive clock cycles, there is no need to consume 1,000 bits to store the same data over and over. Conversely, to limit the amount of data transferred between the emulator and storage media, only that from sequential elements (e.g., registers and memories) is read out. The activity of combinational elements sandwiched between sequential elements can be recreated on-the-fly from the activity of the sequential elements acting as drivers in the workstation connected to the emulator (Figure 1).
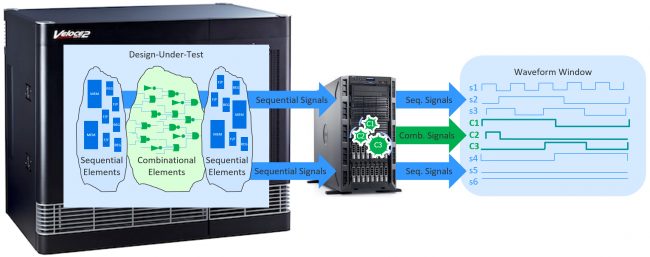
Figure 1: Only sequential activity is transferred from the emulator to the host where a fast algorithm generates the activity of combinational signals sandwiched between sequential elements (Mentor).
Save-and-restore via checkpoints
In the billion-gate era, a test of an embedded design that requires OS boots, the execution of software applications and/or long test sequences can eat up several billion clock cycles. An emulator running at 1MHz processes 1B cycles in 1,000 seconds or about 15 minutes. If a design bug is activated in an application program or in a software test executed after booting the OS, it can result in a run of several hours. To repeat the run, as is typically necessary during debug, you obviously need to multiply that number of hours by the number of necessary, additional runs.
To control this potential proliferation, the industry came up with the idea of taking snapshots across periods of the entire state space of the design-under-test (DUT) and then saving this data externally. These are called ‘checkpoints’.
A DUT can thus be restored to the state it was in when a checkpoint was set, rather than back to the very beginning. Checkpoints thus give the user an ability to rapidly move the emulator run to a desired DUT state.
This is helpful to the verification engineer since a design bug often propagates its malfunction to an observation point close to the time when it was activated; the interval between activation and observation is frequently just a few million clock cycles. If the initial emulation session enabled checkpointing every few million cycles, the verification engineer can stop the run after a design bug shows its effect and restart the run from the closest checkpoint.
There is a high probability that a bug can be traced to its root cause in the time interval between the two checkpoints surrounding where it was first observed. If the bug was activated before that checkpoint, the engineer can still restart the run from an earlier, but still relatively close checkpoint, again rather going all the way back to the beginning.
This capability hinges on the assumption that DUT and test environment are mapped inside the emulator. That is the case with synthesizable testbenches. However, problems arise when emulators are operating under in-circuit emulation (ICE) mode or driven by hardware verification language (HVL) testbenches architected via the transaction/Standard Co-Emulation Modeling Interface (SCEMI)/Universal verification methodology (UVM) approach (also called ‘testbench acceleration’ or ‘co-emulation’).
In ICE mode, the physical test environment driving the DUT is inherently non-repetitive or non-deterministic. A bug can show up across two consecutive emulation runs at different time marks, or even show up in one but not the other. This risk is mitigated on the Veloce emulation platform from Mentor by using the Veloce Deterministic ICE application. It brings determinism to the non-deterministic ICE environment.
But what about HVL testbenches? Those are described at a behavioral level and are not synthesizable into a register transfer level (RTL) construct defined by a state machine. Therefore, they cannot be saved. Checkpointing the DUT but not the testbench leads nowhere.
What can we do to save and restore non-synthesizable testbenches, in particular transaction-based testbenches?
Testbench checkpoints
During testbench acceleration, the testbench setup is known as a dual domain environment; it comprises these two parts:
- A software-based or HVL domain written at a higher level of abstraction than RTL implements whatever verification activities are expected from the testbench, and runs on the workstation.
- A hardware-based or hardware description language (HDL) domain written in RTL code and synthesized onto the emulator implements testbench I/O protocols –– namely, state machines or bus functional models (BFMs) that control the DUT I/O pin transitions.
Communication between the domains consists of multi-cycle transactions instead of signal-level transitions and is implemented using SCEMI-based direct programming interface (DPI) import and export functions and tasks, as well as SCEMI pipe semantics (Figure 2).
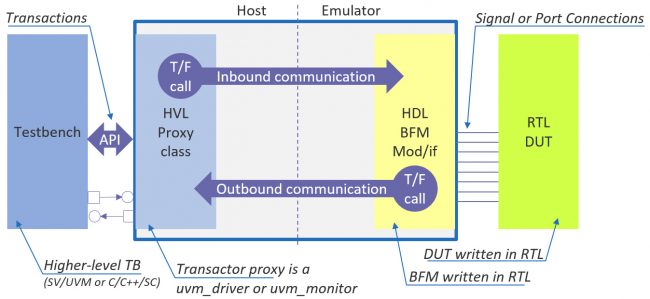
Figure 2: A split transactor converts transactions coming from the testbench into signal-level, protocol-specific sequences required by the DUT and vice versa (Mentor).
The HVL domain is behavioral and untimed. It is the terrain of software developers familiar with software debuggers, breakpoints and sanity checkers such as Purify and Quantify.
The HDL domain must bear the limitations of modern synthesis technology. That is, behavioral constructs are not generally supported (Note [1]). This domain is the ‘comfort zone’ for ASIC designers who use waveforms, triggers and monitors, and also manipulate values in registers and memories.
The two domains require two sets of tools, each is generally fed with different files, and they have different requirements. This rules out the snapshot approach that enables DUT checkpointing. The only solution is to capture the entire activity of the testbench from time ‘0’, including all transactions exchanged between the testbench and the DUT.
In other words, we must separate the HDL DUT from the HVL testbench and transactors, treat them differently and adopt a divide-and-conquer approach.
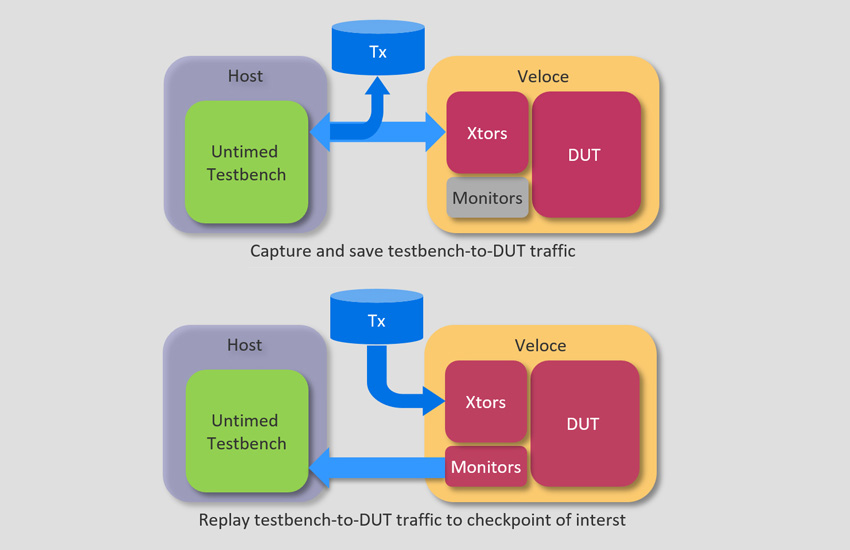
This stops us taking periodic snapshots of the testbench as we can with the DUT. Instead, we must capture and save all the traffic exchanged between the testbench and the DUT, and replay that traffic to reach a DUT checkpoint of interest for debug.
Debug with backup and replay
During traditional debug, the verification engineer runs the emulator until an issue is reached. After a quick analysis, the engineer estimates a time window of interest for tracing the issue, enables data tracing, reruns the emulator and captures the waveforms. This takes a good while longer than a run without waveform capture. When debugging tools such as monitors and trackers are used, execution time slows further.
The backup-and-replay methodology is similar yet different. The backup capture is active from time ‘0’ and set to a time interval small enough for fast turnarounds, but not so small that it leads to excessive checkpointing. When a problem is encountered, the engineer identifies the closest time of interest for debugging and replays the run from the nearest checkpoint before that time without using the HVL testbench. During replay, none of the messages from the DUT to the HVL testbench are executed, except for a few system tasks and assertion violations (See Figure 3.)

Figure 3: Capture and save testbench-DUT traffic and replay that traffic to reach the DUT checkpoint of interest (Mentor).
The backup-and-replay approach improves the efficiency of debug cycles. By jumping to the time window of interest, the engineer can save the time elapsed from zero to the time set for starting replay. Since there is no HVL testbench to execute during replay, throughput is faster because processing is limited to the communication channel between the saved testbench and DUT activity. This reduces trace activity and test data generation on the testbench side.
The approach also enhances the effectiveness of debugging. It can be applied to non-deterministic testbenches and enables more debug information such as custom monitors and trackers, and $display during replay.
To achieve high throughput, the communication channel between the emulator and the host workstation processing the testbench must have large bandwidth and low latency. In one emulation platform, high bandwidth is assured via up to 64 co-modeling channels.
It should be noted that backup-and-replay has limitations. It can only be used in testbench acceleration and cannot be used in the presence of ICE targets.
Debug test case
Let’s assume we want to debug a 50M gate design emulated at 400kHz for 16ms of real-time. The testbench generates 1M packets and the size of the backup database is 119MB.
The following steps are taken.
- Run the emulation with backup enabled and with a backup interval of 20 minutes of wall-clock time.
- The testbench will checkpoint the DUT at the end of each interval.
- 20 MB additional space is required for backup database per interval.
- 20 seconds of additional time is required per interval
- Replay from the third interval (~40-minute wall clock time).
- The testbench will automatically restore the checkpointed DUT.
- Restore will take approximately 20 seconds.
- Upload waveforms and debug.
See more detail in Table 1 and Figure 4.
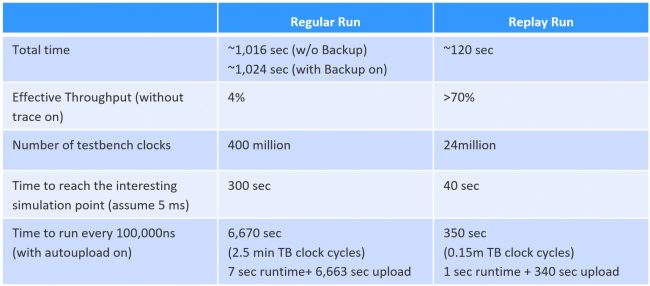
Table 1: The table compares traditional runtime/debug with the backup/restore methodology and shows numerically a boost in runtime efficiency provided by this method (Mentor).
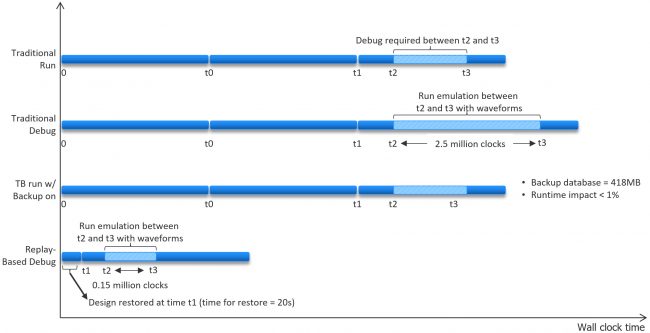
Figure 4: The timeline compares traditional runtime/debug with new backup/restore methodology and shows graphically a boost in runtime efficiency provided by this method (Mentor).
Conclusions
Save-and-restore based on periodic checkpoints has been practiced in gate-level and HDL simulation for many years. The method was not previously adopted for emulation because it could be deployed neither in ICE mode due to the non-deterministic nature of the physical devices nor in testbench acceleration mode due to the non-synthesizable characteristic of the HVL testbench.
The extension of save-and-restore to emulation in testbench acceleration can now be achieved via a divide-and-conquer approach. Such a methodology has already been successfully deployed by numerous users.
As their experiences have shown, backup/replay increases the efficiency of debugging by reducing storage space and speeding up the process. It also improves the debugging effectiveness by allowing the deployment of advanced debugging capabilities and optimizes the utilization of the emulation resources.
Notes
[1] Mentor enhanced the capability to write bus functional models (BFMs) by developing XRTL for eXtended RTL, a superset of SystemVerilog RTL. It includes various behavioral constructs such as implicit state machines, behavioral clock and reset generation, DPI, functions and tasks that can be synthesized onto an emulator.
About the authors
Dr. Lauro Rizzatti is a verification consultant and industry expert on hardware emulation. Previously, Dr. Rizzatti held positions in management, product marketing, technical marketing and engineering.
Vijay Chobisa has more than 12 years of experience in transaction-based acceleration and in-circuit emulation. He is currently the Product Marketing Manager for the Mentor Emulation Division. He worked as a technical marketing engineer and technical marketing manager at IKOS Systems and as an ASIC design engineer at Logic++.